Displaying and Understanding Statistics
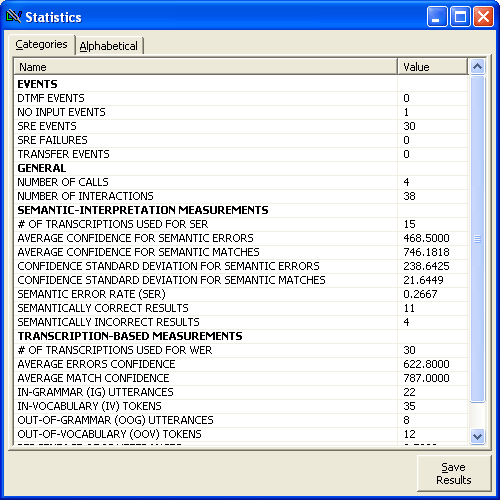
To display the Statistics window, click Show Statistics from the main Tuner window. If you have applied any filters, the statistics you see will apply only for the filtered data.

The default view of the statistics window breaks your statistics down by category. Bolded words are the categories and beneath them are the individual statistics. Clicking the Alphabetical tab will show the same statistics, but listed alphabetically and without category names.
You can save your statistics as a text file by clicking Save Results and selecting a location to save the file.
Understanding the Statistics
Events
DTMF Events
The count of DTMF events currently in the database, after filters are applied.
No Input Events
The count of No Input events currently in the filtered database. No input means the caller did not speak or use the telephone keypad when expected.
SRE Events
The count of speech recognition events currently in the filtered database.
SRE Failures
The count of SRE failures. SRE failures are genuine failures to recognize text. They are generated when, for example, the recognition server fails to respond, there are not enough licenses, the recognition couldnt be completed, etc. SRE failures are not no-match or rejected utterances.
Transfer Events
The count of Transfer Events. Usually Transfer Events are generated when the transfer is to a human fail-over, such as transferring to Operator or Customer Service. Also known as pounding out. Transfer events are very much application dependent events.
General
Number of Calls
The number of calls in the filtered database.
Number of Interactions
The number of interactions in the filtered database. Divide the Number of Interactions by the Number of Calls to get the average number of interactions per call. Each call can includes a start and end filler interaction, though these may be filtered out.
Semantic Interpretation Measurements
The following statistics all provide automatic measurements based on semantic interpretations. The statistics make it easier to set confidence thresholds, and determine where the thresholds are likely to be correct. Semantic interpretation refers to the speech engine's attempts to return a result synonymous with what the caller meant rather than exactly what the caller said.
Semantic interpretation requires transcripts.
# Of Transcriptions used for SER
The total count of transcriptions used for calculating the semantic error rate and other semantic measurements.
Average Confidence for Semantic Errors
The average confidence score for incorrect interpretations.
Average Confidence for Semantic Matches
The average confidence score for correct interpretations.
Average Confidence for Semantic Errors
The average confidence score for incorrect interpretations.
Confidence Standard Deviation for Semantic Matches
The standard deviation for the confidence score, when the interpretation is correct. Used with Average Confidence for Semantic Matches to determine the range of confidence scores with correct interpretations.
In-Semantic Utterances
The number of utterances that were in-grammar and for which the speech engine returned the correct semantic interpretation.
Out-of-Semantic Utterances
The number of utterances that were out-of-grammar or for which the speech engine returned the incorrect semantic interpretation.
Semantic Error Rate
The percentage of times the semantic interpretation returned by the ASR was incorrect. Calculated by dividing the total number of transcriptions by the number of out-of-semantic utterances.
Transcription-Based Measurements
# of Transcriptions Used for WER
The count of transcripts used to determine the in- and out-of-grammar rates. The number of transcriptions involved in grammar coverage measurements may not match the number of transcripts used for calculating WER or SER.
Average Errors Confidence
The average confidence level for instances where the speech engine incorrectly matched a word or phrase.
Average Match Confidence
The average confidence level for instances where the speech engine correctly matched a word or phrase.
In-Grammar Utterances
The number of transcriptions where the recognition grammar correctly represents the callers speech (ignoring noise).
In-Vocabulary Tokens
The number of tokens (words) that were contained in the vocabulary (the vocabulary is the list of all words contained in the active grammars, irrelevant of structure or order).
In-Grammar Utterances
The number of transcriptions where the recognition grammar incorrectly represents the callers speech (ignoring noise).
Out-of-Vocabulary Tokens
The number of tokens (words) that were contained in the vocabulary (the vocabulary is the list of all words contained in the active grammars, irrelevant of structure or order).
Percentage of IG Utterances
The percentage (between 0 and 1.0) of the total transcriptions used for grammar coverage were correctly represented by the recognition grammar.
Percentage of IV Tokens
The percentage (between 0 and 1.0) of the tokens that were were correctly represented by the vocabulary.